
1 Jun
2011
1 Jun
'11
11:45 a.m.
Dear all,
I am running an ordered probit model (DV can be 0,1,2). The model works
out relatively fine. I want to plot the results using ternary plots. I
follow the description from the manual, but there is a slight problem
with the plot. I want to fix one of the IVs to the minimum, while
changing the other IV from minimum to maximum. In the model, there is
also an interaction term between these two variables.
Here is the code for this part:
x.low <- setx(fit.environ, eimp = mineimp, open = minop)
x.high <- setx(fit.environ, eimp = maxeimp, open = minop)
s.out <- sim(fit.environ, x = x.low, x1 = x.high)
ev.high<- s.out$qi$ev + s.out$qi$fd
require(vcd)
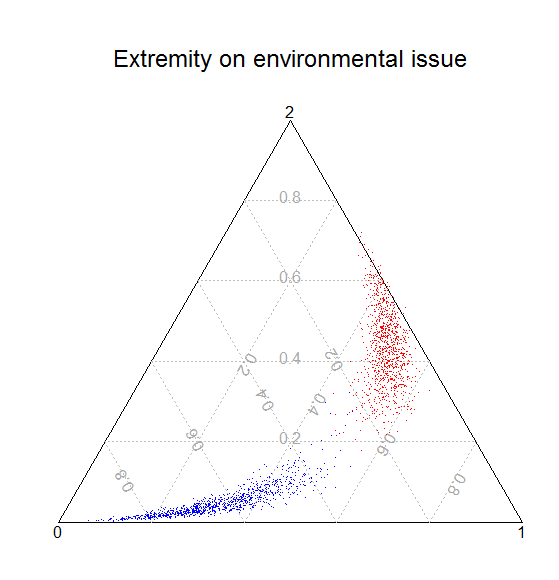
ternaryplot(x = s.out$qi$ev, pch = ".", col = "blue",
main="Extremity on
environmental issue")
ternarypoints(ev.high, pch = ".", col = "red")
The problem: when plotting the values for the situation where importance
(eimp) is at maximum (ev.high), some of the values end up outside the
triangle. I rechecked the ev.high matrix, and all the probabilities add
up to 1 (for each observation), and so it happens for the probabilities
when importance is at minimum. However, if I understand it correctly,
every point should be in the triangle (and because all add up to 1, they
actually should be there). Plot attached.
I was just wondering if anybody else had these sorts of problems. Before
running the model, I used multiple imputation (amelia, 100 imputations),
but I am not sure this should be the problem.
Thank you,
Zoltan Fazekas

1 Jun
1 Jun
5:35 p.m.
Hi Zoltan,
You're correct, all the points should lie in the triangle. The
original function was designed to work on data that was not imputed,
however, and I think there may be something happening with the
imputation and combination of models.
Which model are you calling in the zelig step? Can you check to see
if there is numeric instability in the variance covariance matrices?
After the zelig step, do summary(z.out[[1]]) for each of your multiply
imputed datasets and check to see if the the standard error on each
coefficient is consistent with the other standard errors from the
imputed datasets. That is, you're looking for an imputation set that
gives standard errors that are much larger than the others.
Btw, 100 imputed datasets is usually "overkill" -- Rubin recommends 5-10.
Thanks,
Olivia
On Wed, Jun 1, 2011 at 11:45 AM, Zoltan Fazekas
<zoltan.fazekas(a)gmail.com> wrote:
Dear all,
I am running an ordered probit model (DV can be 0,1,2). The model works out
relatively fine. I want to plot the results using ternary plots. I follow
the description from the manual, but there is a slight problem with the
plot. I want to fix one of the IVs to the minimum, while changing the other
IV from minimum to maximum. In the model, there is also an interaction term
between these two variables.
Here is the code for this part:
x.low <- setx(fit.environ, eimp = mineimp, open = minop)
x.high <- setx(fit.environ, eimp = maxeimp, open = minop)
s.out <- sim(fit.environ, x = x.low, x1 = x.high)
ev.high<- s.out$qi$ev + s.out$qi$fd
require(vcd)
ternaryplot(x = s.out$qi$ev, pch = ".", col = "blue",
main="Extremity on
environmental issue")
ternarypoints(ev.high, pch = ".", col = "red")
The problem: when plotting the values for the situation where importance
(eimp) is at maximum (ev.high), some of the values end up outside the
triangle. I rechecked the ev.high matrix, and all the probabilities add up
to 1 (for each observation), and so it happens for the probabilities when
importance is at minimum. However, if I understand it correctly, every point
should be in the triangle (and because all add up to 1, they actually should
be there). Plot attached.
I was just wondering if anybody else had these sorts of problems. Before
running the model, I used multiple imputation (amelia, 100 imputations), but
I am not sure this should be the problem.
Thank you,
Zoltan Fazekas
-
Zelig Mailing List, served by Harvard-MIT Data Center
Send messages: zelig(a)lists.gking.harvard.edu
[un]subscribe Options: http://lists.gking.harvard.edu/?info=zelig
Zelig program information: http://gking.harvard.edu/zelig/
2 Jun
2 Jun
5:14 a.m.
Dear Olivia,
thank you for the very fast answer and recommendation on the imputation.
I ran again the imputation (5 datasets), cross-checked the standard
errors and they are consistent. Furthermore, I ran the ordered probit
model on the original dataset (normal listwise deletion), and the
problem in plotting persists.
One possible explanation could be that the predicted probability for one
of the categories (the smallest), is extremely small if I fix the two
values to their maximum (predicted probabilities for the smallest
category: min = 0.01, max = 0.076, mean = 0.033, var = 0.0008), and thus
they would have to end up on one of the border's of the triangle,
getting it a bit overcrowded. If I only fix these values to their mean
to get the difference in predicted probabilities for a switch from
minimum to mean, the plot looks as it should look. This, might cause a
problem with regard to the calculation method presented on the
function's description: "A points' coordinates are found by computing
the gravity center of mass points using the data entries as weights.
Thus, the coordinates of a point P(a,b,c),/a + b + c = 1/, are: P(b +
c/2, c * sqrt(3)/2)." I could not come up with other possible
explanation, since (1) the problem persists even if not imputed datasets
are used, and (2) there is no problem even when imputed datasets are
used if one of the predicted probabilities is not that strikingly low.
Again, thank you very much for the help.
Best,
Zoltan
On 6/1/2011 10:35 PM, Olivia Lau wrote:
Hi Zoltan,
You're correct, all the points should lie in the triangle. The
original function was designed to work on data that was not imputed,
however, and I think there may be something happening with the
imputation and combination of models.
Which model are you calling in the zelig step? Can you check to see
if there is numeric instability in the variance covariance matrices?
After the zelig step, do summary(z.out[[1]]) for each of your multiply
imputed datasets and check to see if the the standard error on each
coefficient is consistent with the other standard errors from the
imputed datasets. That is, you're looking for an imputation set that
gives standard errors that are much larger than the others.
Btw, 100 imputed datasets is usually "overkill" -- Rubin recommends 5-10.
Thanks,
Olivia
On Wed, Jun 1, 2011 at 11:45 AM, Zoltan Fazekas
<zoltan.fazekas(a)gmail.com> wrote:
> Dear all,
>
> I am running an ordered probit model (DV can be 0,1,2). The model works out
> relatively fine. I want to plot the results using ternary plots. I follow
> the description from the manual, but there is a slight problem with the
> plot. I want to fix one of the IVs to the minimum, while changing the other
> IV from minimum to maximum. In the model, there is also an interaction term
> between these two variables.
>
> Here is the code for this part:
>
> x.low<- setx(fit.environ, eimp = mineimp, open = minop)
> x.high<- setx(fit.environ, eimp = maxeimp, open = minop)
> s.out<- sim(fit.environ, x = x.low, x1 = x.high)
> ev.high<- s.out$qi$ev + s.out$qi$fd
> require(vcd)
> ternaryplot(x = s.out$qi$ev, pch = ".", col = "blue",
main="Extremity on
> environmental issue")
> ternarypoints(ev.high, pch = ".", col = "red")
>
> The problem: when plotting the values for the situation where importance
> (eimp) is at maximum (ev.high), some of the values end up outside the
> triangle. I rechecked the ev.high matrix, and all the probabilities add up
> to 1 (for each observation), and so it happens for the probabilities when
> importance is at minimum. However, if I understand it correctly, every point
> should be in the triangle (and because all add up to 1, they actually should
> be there). Plot attached.
>
> I was just wondering if anybody else had these sorts of problems. Before
> running the model, I used multiple imputation (amelia, 100 imputations), but
> I am not sure this should be the problem.
>
> Thank you,
> Zoltan Fazekas
>
4735
days inactive
4736
days old
2 comments
2 participants
participants (2)
-
 Olivia Lau
 -
 Zoltan Fazekas